microsoft dp-600 practice test
Implementing Analytics Solutions Using Microsoft Fabric
Question 1
Note: This question is part of a series of questions that present the same scenario. Each question in the series contains a unique solution that might meet the stated goals. Some question sets might have more than one correct solution, while others might not have a correct solution.
After you answer a question in this section, you will NOT be able to return to it. As a result, these questions will not appear in the review screen.
You have a Fabric tenant that contains a lakehouse named Lakehouse1. Lakehouse1 contains a Delta table named Customer.
When you query Customer, you discover that the query is slow to execute. You suspect that maintenance was NOT performed on the table.
You need to identify whether maintenance tasks were performed on Customer.
Solution: You run the following Spark SQL statement:
REFRESH TABLE customer Does this meet the goal?
- A. Yes
- B. No
Answer:
b
Question 2
You have a Fabric tenant that contains a warehouse.
A user discovers that a report that usually takes two minutes to render has been running for 45 minutes and has still not rendered.
You need to identify what is preventing the report query from completing.
Which dynamic management view (DMV) should you use?
- A. sys.dm_exec_requests
- B. sys.dm_exec_sessions
- C. sys.dm_exec_connections
- D. sys.dm_pdw_exec_requests
Answer:
d
Question 3
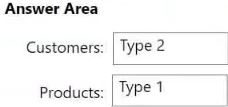
DRAG DROP
You are implementing two dimension tables named Customers and Products in a Fabric warehouse.
You need to use slowly changing dimension (SCD) to manage the versioning of data. The solution must meet the requirements shown in the following table.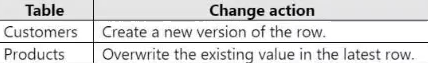
Which type of SCD should you use for each table? To answer, drag the appropriate SCD types to the correct tables. Each SCD type may be used once, more than once, or not at all. You may need to drag the split bar between panes or scroll to view content.
NOTE: Each correct selection is worth one point.
Answer:
Question 4
You have a Fabric tenant that contains a lakehouse named Lakehouse1. Lakehouse1 contains an unpartitioned table named Table1.
You plan to copy data to Table1 and partition the table based on a date column in the source data.
You create a Copy activity to copy the data to Table1.
You need to specify the partition column in the Destination settings of the Copy activity.
What should you do first?
- A. From the Destination tab, set Mode to Append.
- B. From the Destination tab, select the partition column.
- C. From the Source tab, select Enable partition discovery.
- D. From the Destination tabs, set Mode to Overwrite.
Answer:
d
Question 5
You have a Fabric tenant that contains a warehouse. The warehouse uses row-level security (RLS).
You create a Direct Lake semantic model that uses the Delta tables and RLS of the warehouse.
When users interact with a report built from the model, which mode will be used by the DAX queries?
- A. DirectQuery
- B. Dual
- C. Direct Lake
- D. Import
Answer:
d
Question 6
Case study
This is a case study. Case studies are not timed separately. You can use as much exam time as you would like to complete each case. However, there may be additional case studies and sections on this exam. You must manage your time to ensure that you are able to complete all questions included on this exam in the time provided.
To answer the questions included in a case study, you will need to reference information that is provided in the case study. Case studies might contain exhibits and other resources that provide more information about the scenario that is described in the case study. Each question is independent of the other questions in this case study.
At the end of this case study, a review screen will appear. This screen allows you to review your answers and to make changes before you move to the next section of the exam. After you begin a new section, you cannot return to this section.
To start the case study To display the first question in this case study, click the Next button. Use the buttons in the left pane to explore the content of the case study before you answer the questions. Clicking these buttons displays information such as business requirements, existing environment, and problem statements. If the case study has an All Information tab, note that the information displayed is identical to the information displayed on the subsequent tabs. When you are ready to answer a question, click the Question button to return to the question.
Overview
Contoso, Ltd. is a US-based health supplements company. Contoso has two divisions named Sales and Research. The Sales division contains two departments named Online Sales and Retail Sales. The Research division assigns internally developed product lines to individual teams of researchers and analysts.
Existing Environment
Identity Environment
Contoso has a Microsoft Entra tenant named contoso.com. The tenant contains two groups named ResearchReviewersGroup1 and ResearchReviewersGroup2.
Data Environment
Contoso has the following data environment:
The Sales division uses a Microsoft Power BI Premium capacity.
The semantic model of the Online Sales department includes a fact table named Orders that uses Import made. In the system of origin, the OrderID value represents the sequence in which orders are created.
The Research department uses an on-premises, third-party data warehousing product.
Fabric is enabled for contoso.com.
An Azure Data Lake Storage Gen2 storage account named storage1 contains Research division data for a product line named Productline1. The data is in the delta format.
A Data Lake Storage Gen2 storage account named storage2 contains Research division data for a product line named Productline2. The data is in the CSV format.
Requirements
Planned Changes
Contoso plans to make the following changes:
Enable support for Fabric in the Power BI Premium capacity used by the Sales division.
Make all the data for the Sales division and the Research division available in Fabric.
For the Research division, create two Fabric workspaces named Productline1ws and Productine2ws.
In Productline1ws, create a lakehouse named Lakehouse1.
In Lakehouse1, create a shortcut to storage1 named ResearchProduct.
Data Analytics Requirements
Contoso identifies the following data analytics requirements:
All the workspaces for the Sales division and the Research division must support all Fabric experiences.
The Research division workspaces must use a dedicated, on-demand capacity that has per-minute billing.
The Research division workspaces must be grouped together logically to support OneLake data hub filtering based on the department name.
For the Research division workspaces, the members of ResearchReviewersGroup1 must be able to read lakehouse and warehouse data and shortcuts by using SQL endpoints.
For the Research division workspaces, the members of ResearchReviewersGroup2 must be able to read lakehouse data by using Lakehouse explorer.
All the semantic models and reports for the Research division must use version control that supports branching.
Data Preparation Requirements
Contoso identifies the following data preparation requirements:
The Research division data for Productline1 must be retrieved from Lakehouse1 by using Fabric notebooks.
All the Research division data in the lakehouses must be presented as managed tables in Lakehouse explorer.
Semantic Model Requirements
Contoso identifies the following requirements for implementing and managing semantic models:
The number of rows added to the Orders table during refreshes must be minimized.
The semantic models in the Research division workspaces must use Direct Lake mode.
General Requirements
Contoso identifies the following high-level requirements that must be considered for all solutions:
Follow the principle of least privilege when applicable.
Minimize implementation and maintenance effort when possible.
What should you use to implement calculation groups for the Research division semantic models?
- A. Microsoft Power BI Desktop
- B. the Power BI service
- C. DAX Studio
- D. Tabular Editor
Answer:
b
Question 7
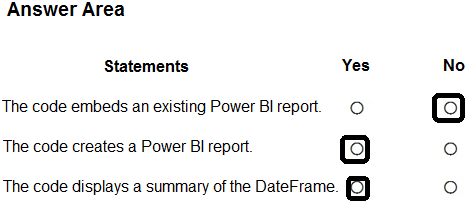
HOTSPOT You have a Fabric tenant.
You plan to create a Fabric notebook that will use Spark DataFrames to generate Microsoft Power BI visuals.
You run the following code.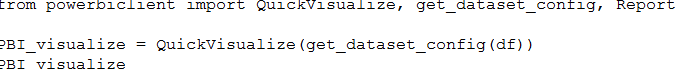
For each of the following statements, select Yes if the statement is true. Otherwise, select No.
NOTE: Each correct selection is worth one point.
Answer:
Question 8
You have a Fabric tenant that contains a semantic model. The model contains 15 tables.
You need to programmatically change each column that ends in the word Key to meet the following requirements:
Hide the column.
Set Nullable to False
Set Summarize By to None.
Set Available in MDX to False.
Mark the column as a key column.
What should you use?
- A. Microsoft Power BI Desktop
- B. ALM Toolkit
- C. Tabular Editor
- D. DAX Studio
Answer:
c
Question 9
You have a Fabric tenant that contains a semantic model named Model1. Model1 uses Import mode. Model1 contains a table named Orders. Orders has 100 million rows and the following fields.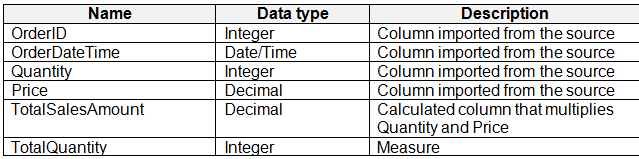
You need to reduce the memory used by Model1 and the time it takes to refresh the model.
Which two actions should you perform? Each correct answer presents part of the solution.
NOTE: Each correct answer is worth one point.
- A. Split OrderDateTime into separate date and time columns.
- B. Replace TotalQuantity with a calculated column.
- C. Convert Quantity into the Text data type.
- D. Replace TotalSalesAmount with a measure.
Answer:
bd
Question 10
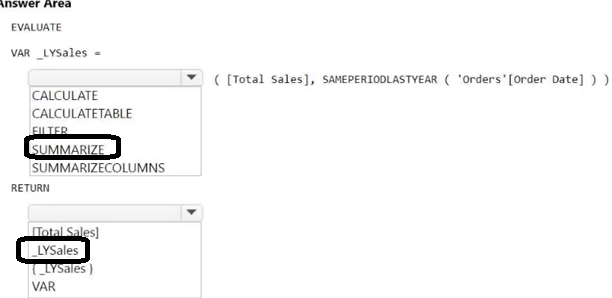
HOTSPOT
You have a Fabric tenant that contains a semantic model. The model contains data about retail stores.
You need to write a DAX query that will be executed by using the XMLA endpoint. The query must return the total amount of sales from the same period last year.
How should you complete the DAX expression? To answer, select the appropriate options in the answer area.
NOTE: Each correct selection is worth one point.
Answer: